Unit 1 Overview: Thinking Geographically
7 min read•june 18, 2024
Sana Fatah
Riya Patel
Sana Fatah
Riya Patel
AP Human Geography 🚜
320 resourcesSee Units
Introduction: The "Why of Where"
Unit 1 is all about the skills, concepts, and phenomena required to think like a geographer. A common phrase introduced in this unit that serves as the foundation for the entire course is the "why of where"—why are things where they are? Rather than simply memorizing geographic terms and concepts, you'll need to think 🧠 like a geographer by constantly asking why things (people, places, phenomena) are where they are. Here are a few examples from each unit in the course:
- Why are there more people 👱👲👳👴👵👦👧 in China and India than anywhere else in the world? (Population)
- Why are some countries wealthy 💰💲 while many others are not? (Economic Development)
- Why do so many migrants 🚶 come from Africa and the Middle East? (Migration)
- Why is the English language 🗣 and Christianity ⛪ so dominant throughout the world? (Culture)
- Why does globalization—the increasing interconnectedness 🔗 of the world 🗺—serve as a strength and threat to people groups? (Culture/Industry)
- Why does the European Union exist, and why did Great Britain leave the EU? (Political)
- Why have Americans become obsessed with organic foods 🍅🍇🍉🍌🍏🍑🍓🌾🌿 in recent years? (Food & Agriculture)
- Why are our clothes, smartphones 📱, and cars 🚙 made in factories 🏭 outside the US? (Industry)
- Why are the largest cities 🌆 in the world in some of the poorest countries? (Urbanization)
Spatial Analysis
Unit 1 also serves as an introduction to the practice of spatial thinking and analysis. Geographers employ a variety of concepts, skills, and tools to enhance their understanding of the world. Developing an understanding of location, distance, direction, patterns, and interconnections is essential to developing spatial analysis skills.
What is Spatial Thinking?
Spatial thinking is the ability to understand and reason about relationships between objects in space. It is a key skill that allows us to understand and interpret maps, diagrams, and other visual representations of data. Spatial analysis is the process of using spatial thinking to analyze data and solve problems.
Spatial thinking and analysis can be used in a wide range of fields, including geography, computer science, engineering, urban planning, and many others. Some examples of how spatial thinking and analysis can be used include:
- Analyzing patterns and trends in geographical data, such as population density, land use, or economic activity
- Designing and analyzing transportation networks, such as roads, rail systems, or air routes
- Modeling and simulating complex systems, such as ecosystems, urban growth, or supply chain networks
- Visualizing and interpreting data for decision-making or communication purposes, such as creating maps or diagrams to communicate information to others
Spatial thinking and analysis involve the use of both analytical and creative skills, and they require the ability to visualize and manipulate abstract concepts in a spatial context.
Location & Place
Spatial thinking involves understanding the difference between absolute and relative location.
Absolute location refers to the specific coordinates of a place on the earth's surface, such as its latitude and longitude. Absolute location is fixed and does not change.
Relative location refers to the location of a place in relation to other places. It is often described using terms like "north of," "south of," "near," or "far from." Relative location is subjective and can vary depending on the context and the perspective of the person describing it.
For example, the absolute location of New York City is 40.7128° N, 74.0060° W. Its relative location could be described as being on the east coast of the United States, north of Washington D.C. and south of Boston.
Absolute and relative location are both important concepts in geography and spatial analysis. Absolute location is necessary for precise navigation and location-based services, while relative location is useful for understanding the spatial relationships between places and for describing the location of a place in a more general sense.
A spatial perspective also includes a proper understanding of the concept of place—the specific human 👪 (race & ethnicity) and physical characteristics 🌄 (climate, presence of rivers, mountains, etc.) of a location.
Distance & Connection
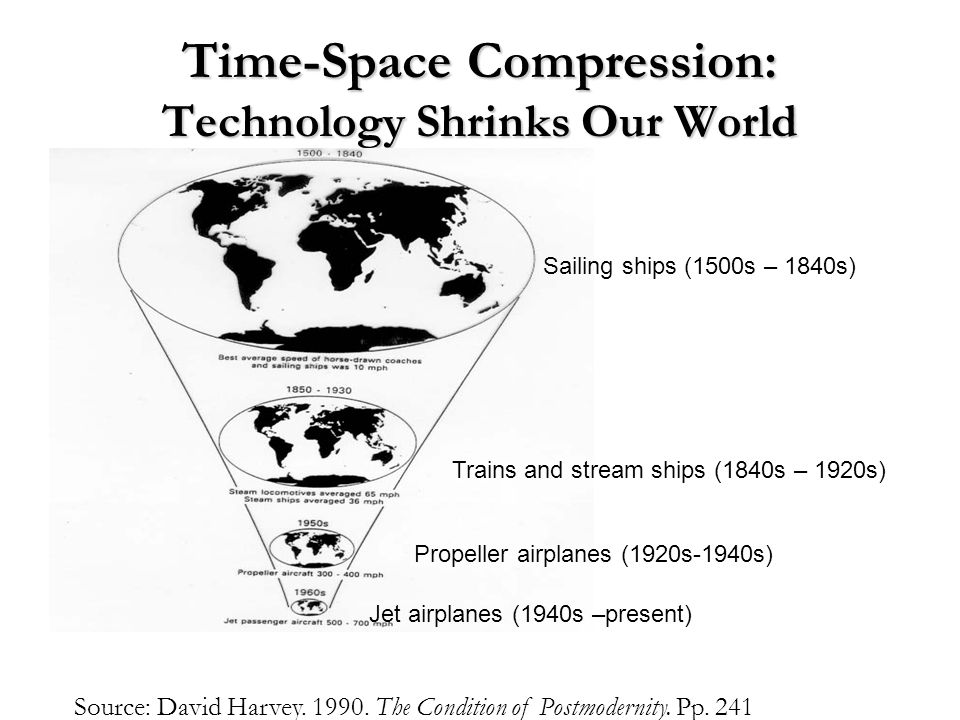
Understanding how far apart people and places are from each other is another crucial component of spatial thinking. Knowing the physical distance and the "time distance" ⏰📏 between people and places are equally important to geographers. Time distance simply means the amount of time between places ("a 2-hour drive from Sacramento to San Francisco"). Geographers are increasingly analyzing the concept of time-space compression to better understand how modern communication 📞📱 and transportation technologies 🚙✈🚁 have decreased the time-space between places and increased connections between people and places throughout the world.

Image from The Condition of Postmodernity
Density & Distribution
Other tools in a geographer's skillset are looking at the density and distribution patterns of different places. Density is simply the number of something in a defined area (the population of Brooklyn, New York), while distribution is the way something is spread out over an area (where different types of people live in neighborhoods throughout Brooklyn). Geographers look for distribution patterns to better understand unique places.
Here are some other examples of density and distribution:
- Density of population: The density of the population in a city can be calculated by dividing the total number of people living in the city by the total land area of the city. For example, if a city has a population of 1 million people and a land area of 100 square miles, the population density would be 10,000 people per square mile.
- Distribution of wealth: The distribution of wealth in a country can be measured by looking at the distribution of income or wealth among the population. For example, a country with a high level of income inequality would have a skewed distribution of wealth, with a small number of people having a large share of the wealth, while the majority of people have a much smaller share.
Maps
Maps are arguably the most important tool utilized by geographers. Maps are important because they allow us to represent and understand the world around us in a spatial context. Maps can be used for a wide variety of purposes, including:
- Navigating from one place to another: Maps can help us orient ourselves and plan our travels by providing information about the locations and relationships of different places.
- Understanding and analyzing spatial patterns and trends: Maps can help us visualize and understand spatial patterns and trends in data, such as population density, economic activity, or environmental conditions.
- Communicating information: Maps can be used to communicate information about a place or region to others, such as through the use of symbols, colors, and labels.
- Making decisions: Maps can be used as a tool for decision-making, such as in the fields of urban planning, resource management, or emergency response.
Overall, maps are an important tool for helping us to understand and interact with the world around us, and they play a vital role in many different fields and disciplines.
Unit 1 introduces a variety of types of maps, the difference between map scale and geographic scale, and various types of map projections and the strengths 💪 and weaknesses 😩 of each. While understanding how to read physical and political maps is important, the unit will cover how to analyze data presented in thematic maps.
Thematic maps are a type of map that focuses on a specific theme or subject, rather than on general geographic information. Some common types of thematic maps include:
- Choropleth maps: These maps use color or patterns to show the distribution of a particular variable or data set.
- Proportional symbol maps: These maps use symbols, such as circles or squares, to represent the size or quantity of a particular variable or data set.
- Dot density maps: These maps use a dot symbol to represent a quantity of a particular variable or data set. The size and spacing of the dots reflect the density of the data.
- Isarithmic maps: These maps use lines to show equal intervals or changes in a particular variable or data set.
- Flow maps: These maps show the movement of people or goods from one place to another over time.
- Cartograms: These maps use a particular variable, such as population, to distort the size or shape of geographic areas in order to better represent the distribution of the data.
There are many other types of thematic maps as well, each with its own unique features and purposes.
Watch: APHUG - Maps, Maps, Maps
Regions
Finally, Unit 1 will introduce the concept of regionalization.
Regionalization refers to the process of dividing a large area into smaller regions or territories, often based on shared characteristics or common interests. Regionalization can be used for a variety of purposes, such as:
- Administrative: Dividing a country or other large area into smaller regions for the purpose of local governance and decision-making.
- Economic: Creating regional economic development programs or trade agreements to promote economic cooperation within a specific region.
- Cultural: Identifying and preserving regional cultural traditions and identities within a larger national or global context.
- Environmental: Defining regional boundaries for the purpose of resource management or conservation.
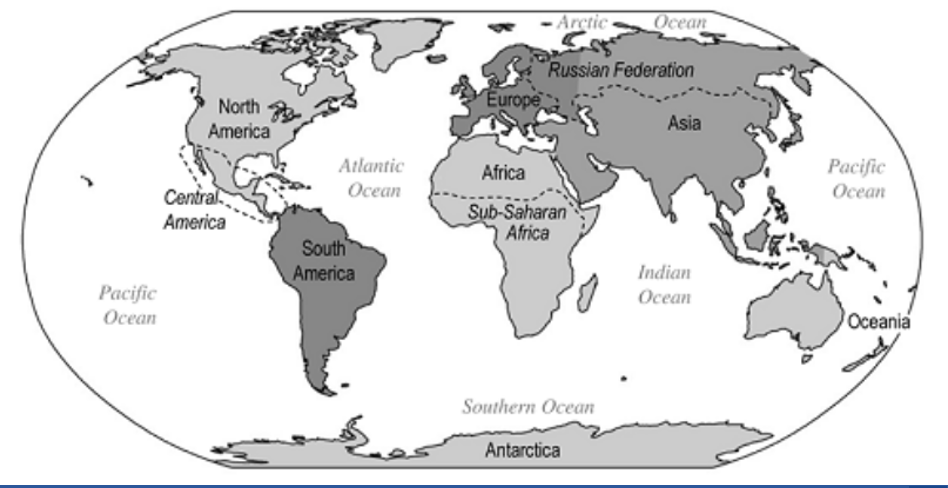
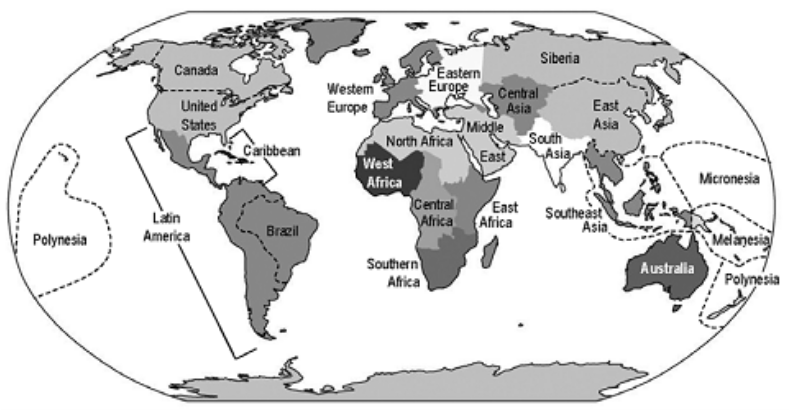
Regions are important in the process of spatial analysis because they allow geographers to learn about patterns, processes, and connections 🔗 between places at different scales. The maps below show the regions and sub-regions you'll need to become familiar with as you progress through the course.
World Regions

World Sub Regions

Browse Study Guides By Unit
🗺Unit 1 – Thinking Geographically
👪Unit 2 – Population & Migration
🕌Unit 3 – Cultural Geography
🗳Unit 4 – Political Geography
👨🌾Unit 5 – Agriculture & Rural Land-Use
🌇Unit 6 – Cities & Urban Land-Use
💸Unit 7 – Industrial & Economic Development
🧐Exam Skills
📚Study Tools

© 2024 Fiveable Inc. All rights reserved.